
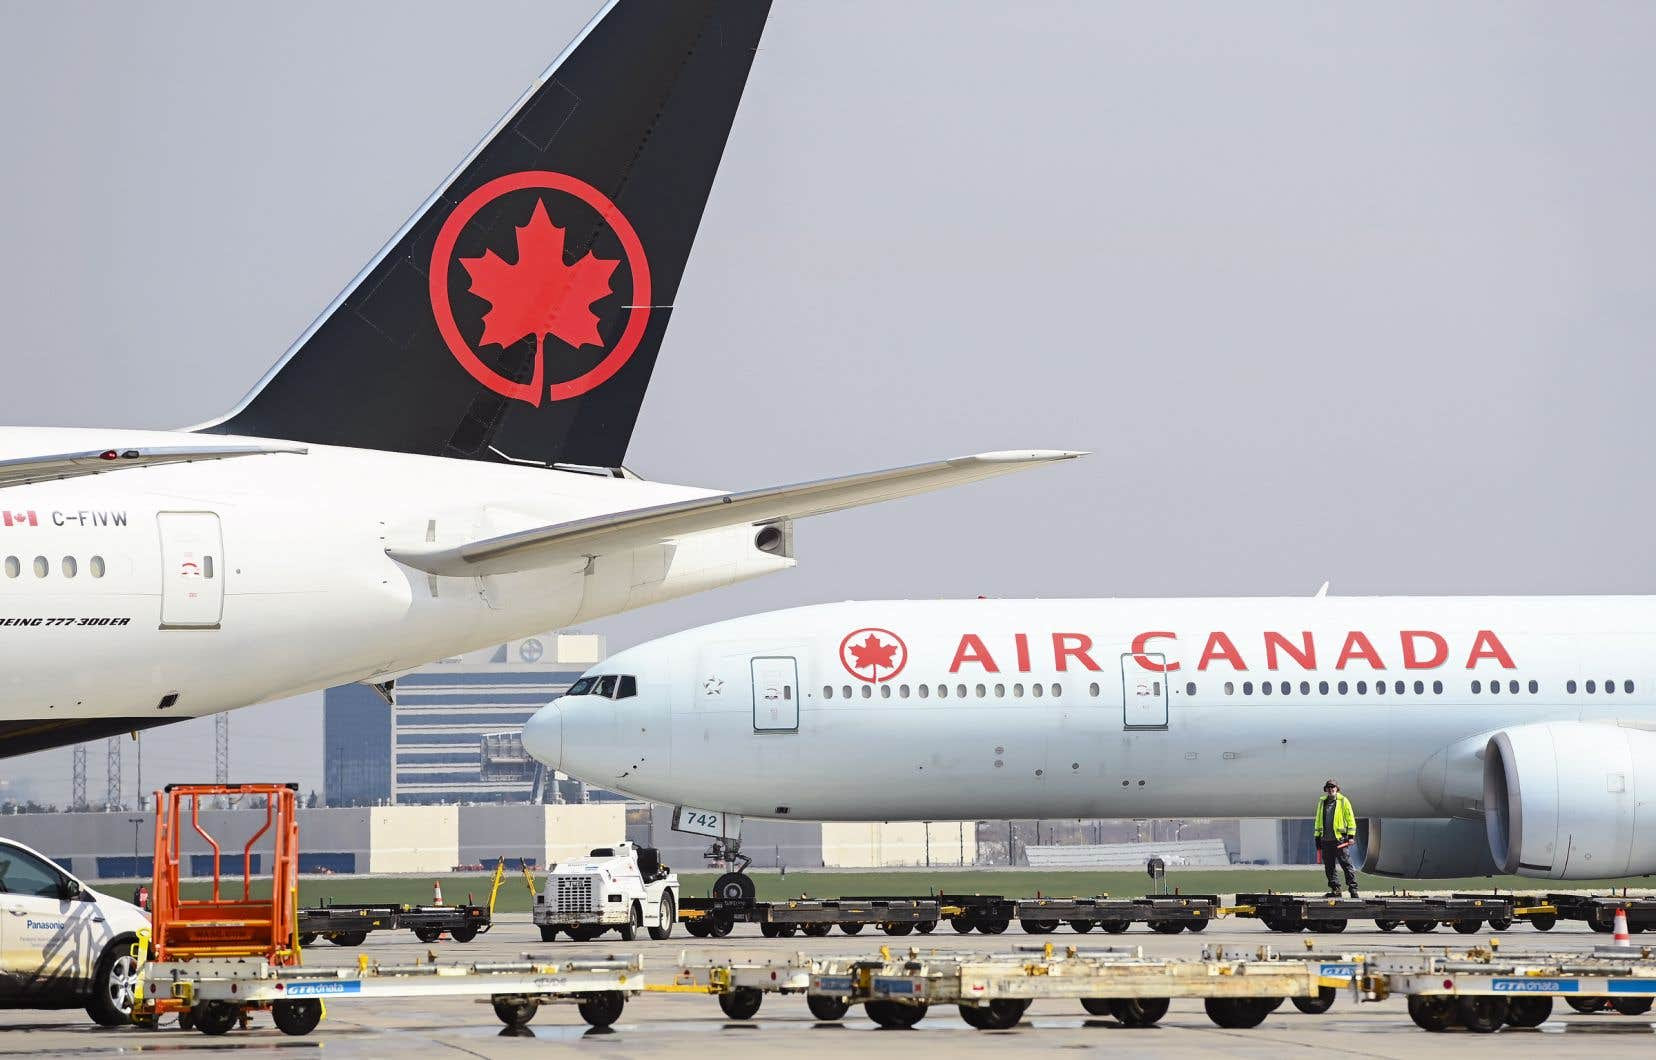
Air Canada accumulates failures and the classification of the very serious “Cirium, the global aviation analytics leader”, mentions very clearly the Canadian company, Air Canada as being a company always behind, and it is classified good last in all the continents even in Africa where companies like Ethiopian Airlines realizes better scores than Air Canada.
It is high time that the Canadian government intervenes and cleans up the mess of this company that is managed in spite of common sense.
As the rankings indicate, Air Canada is not the only Canadian company to be affected by this airline fiasco. West Jet, Air Canada’s Canadian competitor, is doing a bit better than Air Canada, but both Canadian airlines are far behind the U.S. airlines.
It is not only the airlines that are affected by this catastrophic management of airlines because there is also the failure of Canadian airports in the management of flights and baggage since the end of the pandemic.
It is not only the airlines that are affected by this catastrophic management of airlines because there is also the failure of Canadian airports in the management of flights and baggage since the end of the pandemic.
No Canadian airport in the list of the best airports in North America, it is incredible but, it was predictable because the airports of Vancouver, Toronto and Montreal have pulverized all the records of lost luggage, flight delay and flight cancellation.Canadian passengers are being held hostage by Air Canada and Canadian airports that are totally deficient and very, very badly managed.
By the way, the adventure of the actor, Matthew Lewis, famous for his role as Neville Londubat in the Harry Potter movie series, is pathetic. The reaction of the Air Canada hostess is horrible, and Matthew Lewis is not ready to travel again with Air Canada.
Global airline leaders were:
| Airline | On-time ranking | On-time arrival | Total flights |
| (AD) Azul | 1 | 88.93% | 279,722 |
| (NH) ANA | 2 | 88.61% | 162,370 |
| (JL) JAL | 3 | 88.00% | 165,981 |
| (LA) LATAM Airlines | 4 | 86.31% | 451,651 |
| (DL) Delta Air Lines | 5 | 83.63% | 1,004,684 |
| (AV) SA AVIANCA | 6 | 83.48% | 144,525 |
| (EK) Emirates | 7 | 81.30% | 137,589 |
| (UA) United Airlines | 8 | 80.46% | 789,200 |
| (QR) Qatar Airways | 9 | 78.32% | 152,377 |
| (AA) American Airlines | 10 | 78.29% | 1,076,100 |
The top-performing global airports of 2022 were:
| Airport | On-time ranking | On-time departure | Total flights |
| (HND) Haneda Airport | 1 | 90.33% | 373,264 |
| (BLR) Kempegowda International Airport | 2 | 84.08% | 201,897 |
| (SLC) Salt Lake City International Airport | 3 | 83.87% | 226,545 |
| (DTW) Detroit Metropolitan Wayne County Airport | 4 | 82.62% | 271,963 |
| (PHL) Philadelphia International Airport | 5 | 82.54% | 233,777 |
| (MSP) Minneapolis-St. Paul International Airport | 6 | 81.95% | 276,346 |
| (DEL) Indira Gandhi International Airport | 7 | 81.84% | 411,205 |
| (SEA) Seattle-Tacoma International Airport | 8 | 81.04% | 383,250 |
| (BOG) El Dorado International Airport | 9 | 80.72% | 273,721 |
| (CLT) Charlotte Douglas International Airport | 10 | 80.68% | 457,871 |
In North America, the top ten airlines were
Air Canada is last in this ranking
| Airline | On-time ranking | On-time arrival | Total flights |
| (DL) Delta Air Lines | 1 | 83.63% | 1,004,684 |
| (UA) United Airlines | 2 | 80.46% | 789,200 |
| (AS) Alaska Airlines | 3 | 80.36% | 243,072 |
| (AA) American Airlines | 4 | 78.29% | 1,076,100 |
| (WN) Southwest Airlines | 5 | 74.06% | 1,336,888 |
| (F9) Frontier Airlines | 6 | 68.32% | 170,047 |
| (B6) JetBlue Airways | 7 | 66.35% | 343,673 |
| (G4) Allegiant Air | 8 | 65.93% | 117,469 |
| (WS) WestJet | 9 | 59.10% | 94,663 |
| (AC) Air Canada | 10 | 54.51% | 150,602 |
Comment here